This document has been compiled using indicators provided by the Market-Signals trading bot which studies global market data. This document shows the evolution of the strategies proposed by the bot and gives the trends of a selection of ETFs, which follow the main world markets, for April 2023. The strategies hold only long positions. No leverage is used. This document is for information purposes only and should not be taken as investment advice.
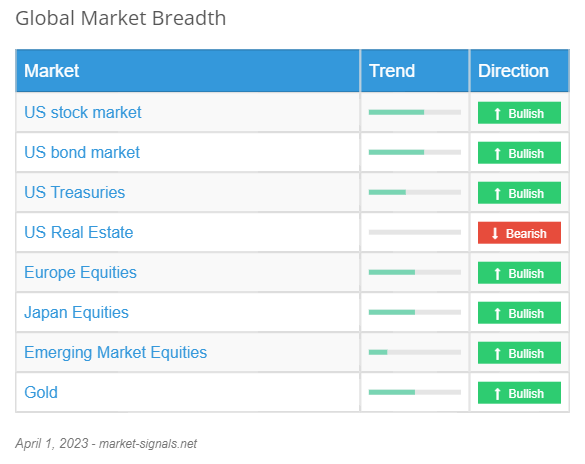
Global Market Breadth
| Market | Trend | Direction |
|---|---|---|
| US stock market |
|
|
| US bond market |
|
|
| US Treasuries |
|
|
| US Real Estate |
|
|
| Europe Equities |
|
|
| Japan Equities |
|
|
| Emerging Market Equities |
|
|
| Gold |
|
Portfolios
US Growth Portfolio
T
he portfolio US Growth rebounds sharply by 9.48% in March. We find a positive trend in the U.S. stock market, we assume a Risk-On market regime and the portfolio is allocated to a U.S. equity ETF. The asset allocation remains the same this month. The ETF selected in the portfolio for this month is QQQ (100%). The portfolio trend for April is measurably bullish with a Trend Score in rise of 9 out of 10. The degree of risk of the strategy for April is medium with a Risk Score in rise of 5 out of 10.
The 1-year change of this strategy is 2.62%. Since opening the portfolio at eToro in November 2019, the strategy has performed 75.01%, in comparison, the benchmark asset (S&P 500) has advanced 42.81%. The strategy has suffered a maximum loss of 19.95% since the portfolio opened at eToro, compared to the benchmark asset (S&P 500) which lost 23.92% at maximum.
This strategy captures the U.S. stock market growth for long-term investors who want high returns.
Since inception at eToro
Max drawdown
Since inception at eToro
Portfolio: -19.95%
S&P 500: -23.92%
- eToro portfolio
US Balanced Portfolio
T
he portfolio US Balanced rises sharply by 7.50% in March. The strategy combines an allocation in US bonds (30%) with the US Growth portfolio (70%). The trend in the US bond market for April is bullish. The bond part contains the following 2 ETFs: JNK and LQD. The asset allocation is as follows: QQQ (70%), JNK (15%) and LQD (15%). The portfolio trend for April is strongly positive with a Trend Score in rise of 8 out of 10. The degree of risk of the strategy for April is medium with a Risk Score steady of 4 out of 10.
The 1-year change of this strategy is 2.44%.
This strategy provides a balanced stocks and bonds allocation for investors who want a U.S. market exposure with limited risks.
Global Conservative Portfolio
T
he portfolio Global Conservative bounced back 2.81% last month. The Strategy combines a multi-market protective asset allocation strategy (Global Stable portfolio 70%) and a US stock market strategy (US Growth portfolio 30%). The ETF selected in the portfolio for this month is QQQ (33%). The portfolio trend for April is lightly positive with a Trend Score in growth of 3 out of 10. The level of risk of the strategy for April is low with a Risk Score in progression of 2 out of 10.
The 1-year trailing return of this strategy is 1.41%.
This strategy provides a broad geographic diversification for investors who want an international exposure.
Global Stable Portfolio
T
he portfolio Global Stable stayed constant in March. The overall market trend for April is weakly bullish. By analyzing a diverse multi-market composed of 12 Trackers (stocks, bonds, gold, real estate, international and emerging markets...), we observe that 8 assets show a positive evolution. Our model allocates 33% to Risk-On assets and 66% to Risk-Off assets. The 6 Trackers of the portfolio for this month are QQQ (5%), SPY (5%), EWJ (5%), GLD (5%), EFA (5%) and VGK (5%). The portfolio trend for April is weakly bullish with a Trend Score in growth of 2 out of 10. The level of risk of the strategy for April is low with a Risk Score in progression of 1 out of 10.
The 1-year trailing return of this portfolio is 0%.
This is the safest strategy, the one with the lowest volatility and the least max drawdown of the 4 offered, that makes this strategy an alternative to a 1-Year Term Deposit.
ETF Trends
QQQ Invesco QQQ
- Nasdaq 100
The QQQ ETF, which measures the Nasdaq-100 Index, rises sharply by 9.32% in March. The 1 year trailing return of this ETF is -11.60%. The trend in April is strongly positive with a Trend Score in progression of 9 out of 10. The level of risk of this ETF in April is medium with a Risk Score in progression of 5 out of 10. This equity is invested in the portfolios US Growth, Global Stable, Global Conservative and US Balanced in April.
BND Vanguard Total Bond Market ETF
- US Total Bond Market
The BND ETF, which mimics intermediate-term bonds being traded in the United States, bounced back 2.44% in March. The performance over a period of 1 year of this ETF is -7.59%. The trend in April is bullish with a Trend Score in rise of 6 out of 10. The degree of risk of this ETF in April is high with a Risk Score in rise of 7 out of 10.
SPY SPDR S&P 500 ETF
- S&P 500
The SPY Exchange-Traded Fund from SPDR, which measures 500 largest US companies, rebounds promptly by 3.31% in March. The evolution of the performance of this ETF over 1 year is -9.31%. The trend in April is positive with a Trend Score in expansion of 6 out of 10. The level of risk of this ETF in this month is medium with a Risk Score unchanged of 4 out of 10. This ETF is invested in the portfolio Global Stable this month.
LQD iShares iBoxx $ Investment Grade Corporate Bond
- US Corporate Bonds
The LQD ETF, which monitors U.S. investment grade corporate bonds, rebounds promptly by 3.48% last month. The evolution of the performance of this ETF over 1 year is -9.17%. The trend in April is positive with a Trend Score in growth of 5 out of 10. The level of risk of this ETF in April is medium with a Risk Score in regression of 4 out of 10. This ETF is invested in the strategy US Balanced in April.
GLD SPDR Gold
- Gold
The GLD Exchange-Traded Fund, which tracks the performance of the price of gold bullion, rebounds promptly by 7.92% last month. The 1 year trailing return of this ETF is 1.67%. The trend in this month is bullish with a Trend Score in progression of 5 out of 10. The degree of risk of this ETF in this month is high with a Risk Score in progression of 7 out of 10. This ETF is present in the strategy Global Stable in April.
EWJ iShares MSCI JAPAN ETF
- Japan Equities
The EWJ ETF, which mimics the Japanese stock market, rises sharply by 4.92% in March. The 1 year trailing return of this equity is -4.92%. The trend in April is bullish with a Trend Score in growth of 5 out of 10. The degree of risk of this equity in April is low with a Risk Score steady of 3 out of 10. This equity is invested in the strategy Global Stable in April.
EFA iShares MSCI EAFE ETF
- Europe, Australia and Far East Equities
The EFA ETF, which follows markets in Europe, Australia and the Far East, rises sharply by 3.13% in March. The 1 year trailing return of this ETF is -2.74%. The trend in April is positive with a Trend Score in expansion of 5 out of 10. The level of risk of this ETF in April is medium with a Risk Score in expansion of 4 out of 10. This ETF is present in the portfolio Global Stable in April.
VGK Vanguard FTSE Europe ETF
- Europe Equities
The VGK Exchange-Traded Fund from Vanguard, which replicates an all-cap index of European securities, shifted upwards 2.09% in March. The performance over a period of 1 year of this ETF is -3.23%. The trend in April is bullish with a Trend Score in growth of 5 out of 10. The degree of risk of this ETF in April is medium with a Risk Score in growth of 4 out of 10. This ETF is invested in the strategy Global Stable this month.
IEF iShares 7-10 Year Treasury Bond ETF
- Intermediate-term US Treasuries
The IEF ETF from iShares, which follows intermediate-term U.S. Treasury bonds, rises sharply by 3.51% in March. The 1 year trailing return of this equity is -7.48%. The trend in April is positive with a Trend Score in expansion of 4 out of 10. The level of risk of this equity in April is high with a Risk Score in expansion of 7 out of 10.
TLT iShares 20+ Year Treasury Bond ETF
- Long-Term US Treasuries
The TLT ETF, which follows long-dated US Treasuries, rebounds sharply by 4.58% last month. The performance over a period of 1 year of this ETF is -19.70%. The trend in April is positive with a Trend Score in growth of 4 out of 10. The level of risk of this ETF in April is medium with a Risk Score constant of 5 out of 10.
JNK SPDR Bloomberg High Yield Bond
- High Yield Bonds
The JNK ETF, which monitors the Bloomberg Barclays US High Yield index, shifted upwards 1.56% in March. The evolution of the performance of this equity over 1 year is -9.80%. The trend in April is lightly bullish with a Trend Score in progression of 3 out of 10. The degree of risk of this equity in April is low with a Risk Score in regression of 2 out of 10. This equity is invested in the strategy US Balanced in April.
MDY SPDR S&P Midcap 400
- Midcap 400
The MDY Exchange-Traded Fund from SPDR, which follows mid-cap U.S. Equities, decreases sharply by 3.44% in March. The performance over a period of 1 year of this ETF is -6.53%. The trend in April is weakly bullish with a Trend Score unchanged of 3 out of 10. The level of risk of this ETF in this month is medium with a Risk Score in expansion of 6 out of 10.
EEM iShares MSCI Emerging Markets ETF
- Emerging Market Equities
The EEM ETF from iShares, which monitors a diversified exposure to emerging markets, rebounds sharply by 3.22% in March. The evolution of the performance of this equity over 1 year is -13.33%. The trend in April is lightly bullish with a Trend Score in expansion of 2 out of 10. The level of risk of this equity in April is medium with a Risk Score in decline of 4 out of 10.
VNQ Vanguard Real Estate ETF
- US Real Estate
The VNQ Exchange-Traded Fund from Vanguard, which replicates the broad U.S. real estate market, falls back promptly by 3.13% in March. The performance over a period of 1 year of this ETF is -23.15%. The trend in this month is bearish. The degree of risk of this ETF in this month is medium with a Risk Score in growth of 6 out of 10.
IWM iShares Russell 2000 ETF
- US Small Cap Equities
The IWM Exchange-Traded Fund from iShares, which replicates an index of US small-cap stocks, decreases sharply by 5.20% in March. The performance over a period of 1 year of this ETF is -13.17%. The trend in this month is bearish. The degree of risk of this ETF in this month is medium with a Risk Score in progression of 6 out of 10.
Compliance disclaimer
This communication is for information and education purposes only and should not be taken as investment advice, a personal recommendation,
or an offer of, or solicitation to buy or sell, any financial instruments.
Natevia makes no representation and assumes no liability as to the accuracy or completeness of the content of this publication,
which has been prepared utilizing publicly-available information.
Past Performance is not indicative of future results.